Showing posts with label Class Project. Show all posts

Sunday, 17 February 2013

Geo-visualization by Cartograms

Cartograms are types of maps in which  statistical information is represented relative to the area of the spatial unit to which the statistical information belongs. Cartograms can be used to create more insight on the spatial distribution of a particular variable with respect to the different spatial areas under consideration.

During the Cartography and Geo-visualization course,  cartograms were used to represent various variables in Kenya. For instance, the maps below show the spatial distribution of poverty in Kenya and accessibility to electricity within the country.
Households with access to electricity in Kenya per county

Cartogram of poverty represented against the areas of counties


Thursday, 11 October 2012

Rectangular Buffer Tools

Apart from using the available GIS tools in readily available commercial and open source software. The course in Msc Applied Geoinformatics provided opportunities for me to apply established GIScience concepts in  creating usable GIS tools. One of such tools was the rectangular buffer script tool created for the ArcGIS 10 software. Using python language, the tool was designed to accept user input including point features and the buffer distance and then computing rectangular buffers around the point features.

Additionally, adequate documentation was provided to help any users of such tools. I have been able to develop small scripts to carry out minor repetitive tasks in ArcGIS 10 including scripts to carry out spline interpolation on point features with many fields in the attribute table.


International Schools, Star Hotels and First Class Hospitals in Nairobi

In this class project, OpenLayers javascript library was used to create a web map application of international schools, top class hotels and international standard hospitals in Nairobi Kenya, this was the key deliverable for the Web Mapping.

In the project, Google Maps, Google hybrid, Google terrain and Open Street Maps were used as base layers while international schools, top star hotels and international standard hospitals were added as over-layers. The overlays were introduced as vector layers with clickable popups as can be seen in the image below.


Friday, 31 August 2012

Europe talks about money

In this class project, a database of twitter data for the continental Europe was analysed with the intention of finding out whether the data could be used extract all the money related talk and whether this information could then be used to make financial decisions. From 14 million tweet streams, slightly more than 200 thousand tweets referred to money in six different languages; English, German, French, Italian, Spanish, Dutch and Greek.  Seven countries in Europe were used for the study, these were United Kingdom (and Northern Ireland), France, Germany, Italy, Netherlands, Spain and Greece. Using GeoTools, Processing (Fry and Reas, 2010) and MapThing (Reades, 2012) libraries in Java, the money related tweets were dynamically mapped for the 29 days in February 2012. 
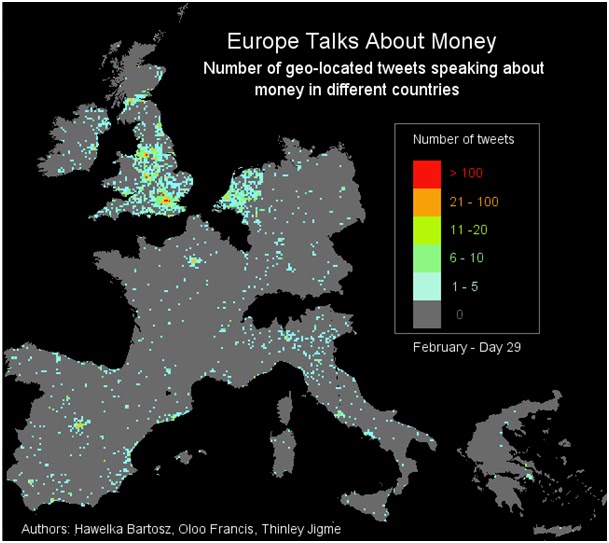
According to the study it was observed that most money related talk takes place in major cities with the most significant city being London.

Screen shot of money related tweets for the 29th February, 2012

Acknowledgements

I acknowledge the inputs from my colleagues Bartosz Hawelka and Jigme Thinley

Further details on the entire scope of the project can be found on http://lbswinners.blogspot.co.at/


References

  1. Fry, B., & Reas, C. (2010). Processing. Retrieved July 10, 2012, from Processing: http://processing.org/reference/frameRate_.html
  2. Reades, J. (2012). Processing Library MapThing. Retrieved July 10, 2012, from Processing Library MapThing: http://www.reades.com/MapThing/